


CELH Growth Projection Part 1
Is CELH Cheap or Expensive?

Important Information Disclosure Below:
Disclaimer: The content of this post is solely my personal opinion and is intended for informational purposes only. It should not be considered financial or investment advice. Always do your own research and consult with a licensed financial advisor before making any investment decisions. Investments carry risks, including the potential loss of principal.
Just as a recap in the prior post we discussed the potential growth story of CELH 0.00%↑ in comparison to its big brother MNST 0.00%↑ to quickly glaze over what the TAM (total addressable market) is for Celsius to give a broader picture of what is possible, assuming they can gain traction and tap into the global demand there is for energy drinks.
Today we will discuss numbers as they pertain to :
Potential revenue growth in international markets they just expanded Q3 24’
(Domestic US markets are tapped out from recent earnings data)
CELH 0.00%↑ Historical Price to Sales Ratio
This will help us understand since IPO is the stock cheap or overvalued?
Using these two metrics for now we will come up with an assumption what their revenue increase can be and how that translates to their potential market cap while finally giving us an assumed price per share target range using the Historical Price to Sales Ratio!
Below is an earnings transcript from Celsius latest earnings, where CEO John Fieldly, highlights the companies efforts in international markets with some already providing good feedback from Australia, New Zealand and UK. Earnings Transcript Source

When I read this, the first question is well nice they’re expanding but how big is the pie here for these markets to be worth the efforts and if executed properly?
The market share of EMEA ( European, Middle East, Africa ) sales in terms of size is $22.12 billion. (At this time CELH reported $54 million YTD for 24’)

Source from Mordor Intelligence


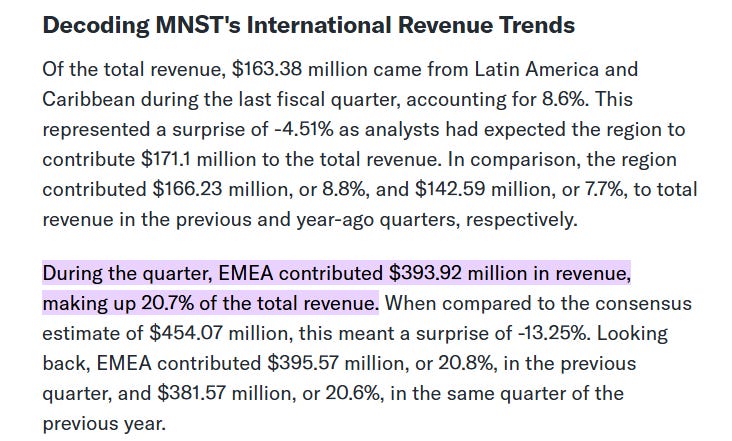
Lets analyze big brother, Monster Energy, of all the revenue they make worldwide EMEA market accounts for ~20% or said better, ~$393.92 million in revenue, this quarter alone at an annualized rate of ~$1.5 billion comes from these European markets. So its fair to assume Celsius is coming for more than just lunch money here.
As we compile this data and we assume the Total Addressable Market in terms of demand from total revenues, the question then becomes can Celsius compete and grab some of this market share? If so, what is a fair assumption that is conservative and how will this impact the stock price from where it stands now between $26-$29?
Lets compare apples to apples in this current market and see how CELH 0.00%↑ and MNST 0.00%↑ US revenues line up as they are in their biggest which is North America.
At this time the YoY revenue of Monster in North America stands at ~4.42 billion of at 27 billion dollar industry which is ~16% of all sales.
Comparatively Celsius YoY revenue sits at ~969 million which equates to 3-4% of all sales.
In EMEA market size per illustration above is 22 billion of which Monster has 1.5 billion in sales or 6-7% of all sales.
Assuming Celsius can breach and maintain a similar sales ratio 4:1 in EMEA markets that would put estimated sales 1% of the 22 billion as it stands today at ~220 million. (As of of today they captured $54 million per latest report) a 300% growth potential.
Using these metrics above with assumed 3-5 year time for this growth to manifest as the energy drink market is also expected to grow at the same time at a 7% CAGR in EMEA markets and 8.3% CAGR in USA we can forward project what the revenues for CELH 0.00%↑ can ultimately be in a 3-5 year span below!

As Celsius expands into European, Middle East and Africa (EMEA) over the next 3 years and as this market demand for energy drinks grows at 7% CAGR we can assume the total addressable market will be ~27 billion with Celsius able to capture just 1% of all sales yearly would add ~270 million in annual revenue.
While Celsius maintains its market share in North America assuming no further growth in market share, but just revenue increase in line with CAGR of 8.3% which would be equal to ~34 billion annually, we can assume the YoY revenue would be ~1.19 billion.
For a total revenue : 270 million (EMEA Market) + 1.19 billion (North America) = 1.46 billion in sales a 36% growth in revenue increase. Now lets calculate its value using a Price to sales Calculation:
Below is an illustration of CELH 0.00%↑ avg P/S Sales Ratio over the course of the last 5 years:

If we take 3 data points (high low, mid) in its last 5 years the average P/S ratio is about ~14.
2020 Low P/S + 2021 High P/S + Mid Avg Trail / 3 Sets of Data = Avg P/S
3 + 30 + 10 = 43 / 3 = ~14
Now lets calculate the Market Cap using these metrics to find its projected stock price in this scenario!
Market Cap = Revenue x P/S Ratio
~ 1.46 billion revenue x 14 avg P/S ratio = 20.44 billion Market Cap
Stock Price = Market Cap / Shares Outstanding
20.44 billion Market cap / 233,197,000 = 87.65 price per share.

At the time of coverage for this stock it was trading at ~$26 avg with a conservative estimated growth rate and projected international market growth while North America contracts this analysis assumes price target of $87 per share for a potential return of 219%
Below is my position as it trades new $29, while it is up 13% I have a longer term horizon on this play and currently taking advantage of this cheap growth play by also holding a separate swing trade long to capture a mean reversion back to ~32-35.
